The Security Dashboard is the heart of our Security Audit Platform and gives you a comprehensive overview of your customer's current IT security status.
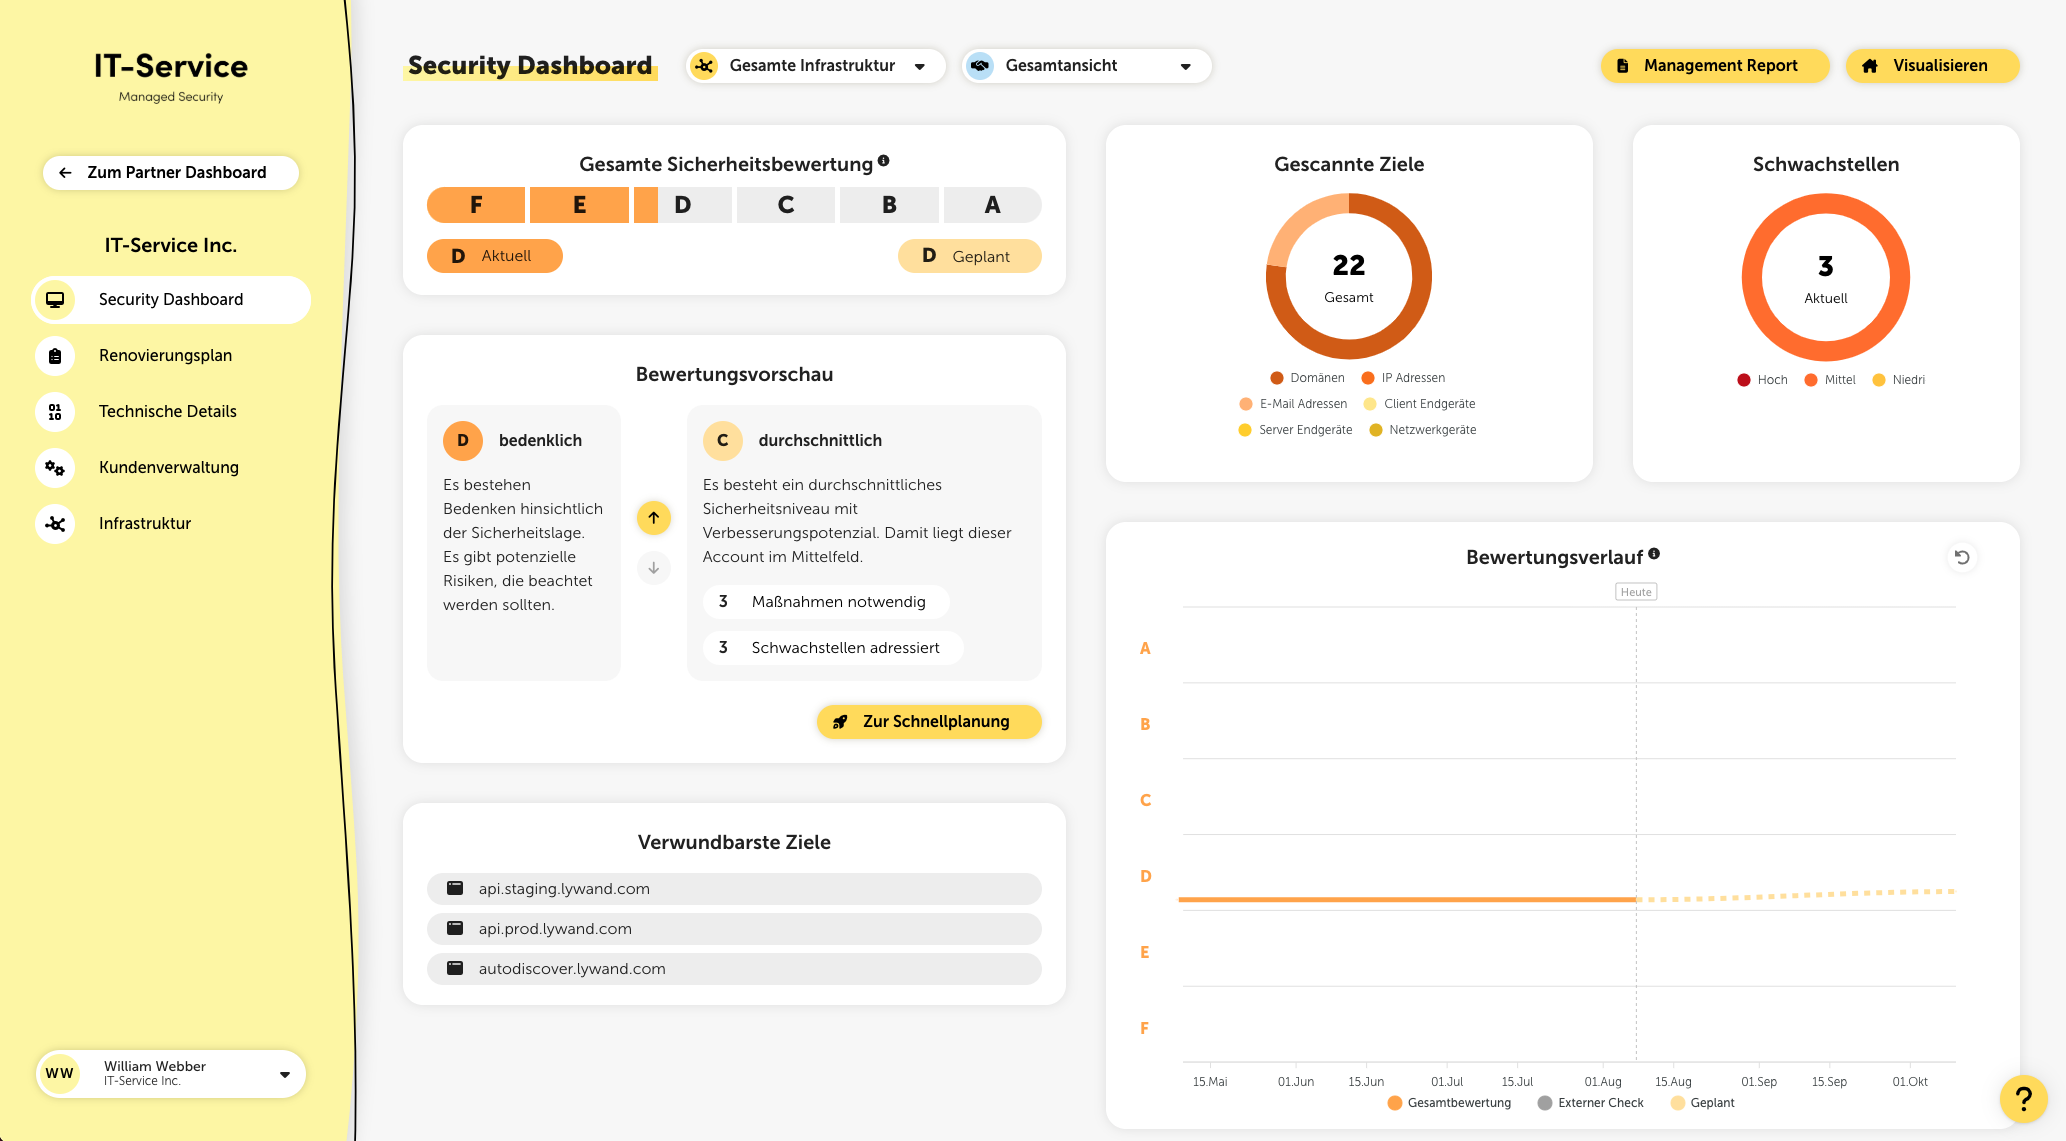
At the very top of the page, you can switch between the overall view and the display of your managed services. The selected setting is retained in the browser you're using across the entire platform and applies to relevant metrics such as the security rating or discovered vulnerabilities.
Using the global filter at the top next to the title, you can filter the displayed metrics by external, internal, or the entire infrastructure.
After a security review is completed, the identified security gaps are classified, summarized, and evaluated based on their urgency, properties, and the affected systems. This results in an overall assessment of the customer's security status, which is shown on a rating scale in the Security Dashboard. Lywand assigns the rating using a school grading system from A to F, where F represents the worst rating.
To view rating details, click the info icon next to the title in the “Overall security rating” card.
Score
The rating is based on a score from 0 to 10, which is mapped linearly to the ratings A to F. The higher the score, the higher the security risk and the worse the rating.
Score calculation
The score results from the sum of the vulnerability risks. Higher risks are weighted exponentially more. So it’s not the number of vulnerabilities that matters, but the risk of each individual vulnerability. To significantly improve the score, you should first fix the vulnerabilities with the highest risks.
A (excellent)
An excellent level of technical security has been achieved and (almost) no security vulnerabilities have been found.
B (good)
A good security performance has been achieved and the IT infrastructure is equipped with reliable security measures.
C (acceptable)
There is an acceptable level of security that is above average. However, there is still room for improvement.
D (concerning)
There are concerns regarding the security situation. There are potential risks that should be taken into account.
E (alarming)
There are alarming security gaps that could possibly be exploited. There is an urgent need for action.
F (critical)
Critical security vulnerabilities were found that could probably be exploited. Immediate action is required.
In the rating preview you’ll find descriptions of all rating levels as well as information about how many measures need to be implemented for each level and how many vulnerabilities are addressed by them.
This metric shows the fulfilled CIS Controls for all your targets. A click on it takes you to the Best Practices page with more information.
At the top right you get an overview of the number of checked targets, broken down into domains, IP addresses, email addresses, and endpoints. There’s also an overview of the open vulnerabilities with risk rating, as well as (if enabled) the number of automatically resolved vulnerabilities through Auto Healing.
The rating history provides information about the long-term development of the security situation. Three areas are distinguished: external, internal, and overall rating. If you move the mouse pointer over the gray dots, you’ll find more information about the external scan.
External: Display of the external checks carried out as dots (snapshots).
Internal: Display of the internal checks carried out as a line (daily), including company-wide vulnerabilities based on questionnaires (e.g.: ransomware).
Overall rating: Display of the combination of external & internal rating as a line.
Planned: Display of the possible rating after implementing already planned measures as a dashed line.
This metric shows you the average time since the last check, averaged across all targets. The lower this value, the more up to date your results are.
This metric gives you an overview of the coverage of the checks carried out for all your targets. The higher the percentage, the more of your targets have already been checked.
In addition to the overall security rating, the identified vulnerabilities are also divided into different categories and evaluated.
The individual categories link here to the corresponding entries in the vulnerability overview.
An exception is the “Ransomware” category: It uses different check indicators to give an overall assessment of the ransomware protection.
The assessment is made up of:
Up-to-dateness of the installed software
Check of antivirus protection, macro security & security best practices
Questionnaires on backup, email security and security awareness
In the subcategories backups, email security and security awareness, questionnaires have to be filled out to generate measures.
For the subcategories macro protection, firewall and antivirus protection, lywand creates tailored recommendations based on the results of the security check. If you click on a specific measure, you can select the corresponding endpoints.
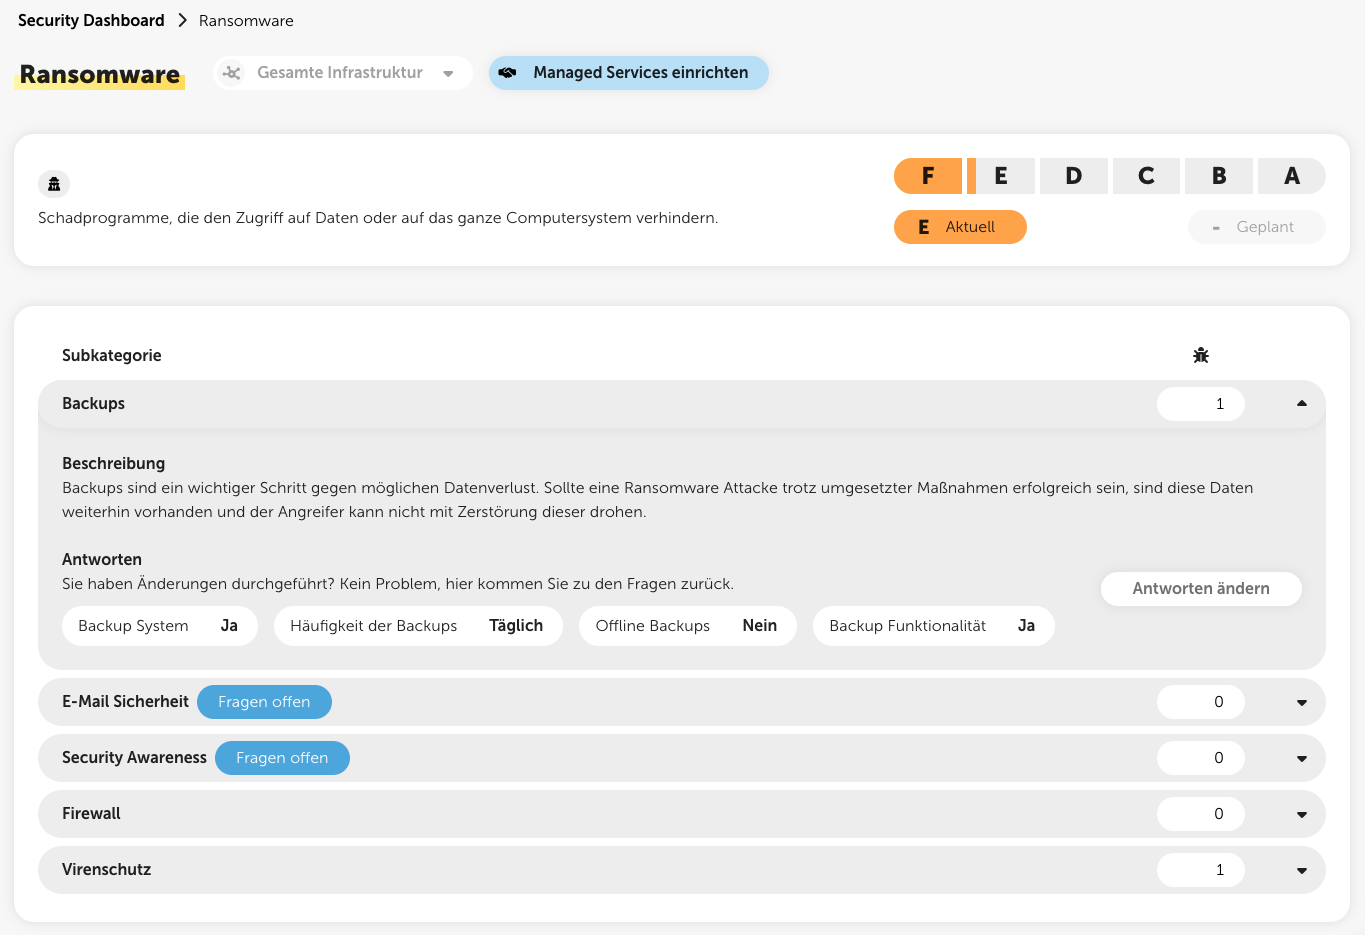
Letters & fill levels
Capital letter & front layer in orange: Rating of the category
Lowercase letter and back layer in salmon: Possible rating that can be achieved with the planned actions
Symbols
?
Questionnaires still have to be filled out to get a rating and then actions for the category.
!
Actions should urgently be planned in the category, since there is currently a bad rating.
-
No actions have been planned yet.
✓
All necessary measures have already been planned, or no measures are required because there are no vulnerabilities in this category.
This list shows you the five most vulnerable targets in the IT infrastructure. Click a target to go straight to the check insights for this target.
This list shows you the five most vulnerable products. If you click a product, you’ll go straight to the vulnerabilities, filtered for this product.
